Breakouts in Corn and Soybean Oil:
- Ian Culley
- Nov 11, 2020
- 2 min read
Updated: Nov 12, 2020
Is It Time to Stand-up Against Commercial Hedgers?
As Corn and Soybean Oil broke above major areas of resistance yesterday, I was hesitant to take action based on the positioning of Commercial Hedgers. Generally, the rule of thumb is not to trade against Commercials when they hold a significant position, and they hold significant short positions in both Corn and Soybean Oil.
The weekly chart of Corn (below) depicts Commercial positioning with the red line at the bottom of the chart. The current COT profile is very similar to past profiles that corresponded with tops in 2016, 2018 and 2019. During the current bottoming process any significant short position held by Commercials has carried a bearish sentiment and has led to a strong reversal in price.
However, in the Fall of 2010 there was an explosive breakout against extreme Commercial short positioning. This breakout did not lead to a reversal in trend, but instead commenced a rip roaring bull market. Not only did price continue to rip higher into the Spring of 2011, it pushed against continued extreme short positioning of Commercial Hedgers (shaded in grey). The current Commercial short positions might not be the same roadblock to higher prices we have experienced over the last 6 years.

The next area of resistance should show up around 460^0 and key areas of support lie with the AVWAPs at 407^0 and 395^0.
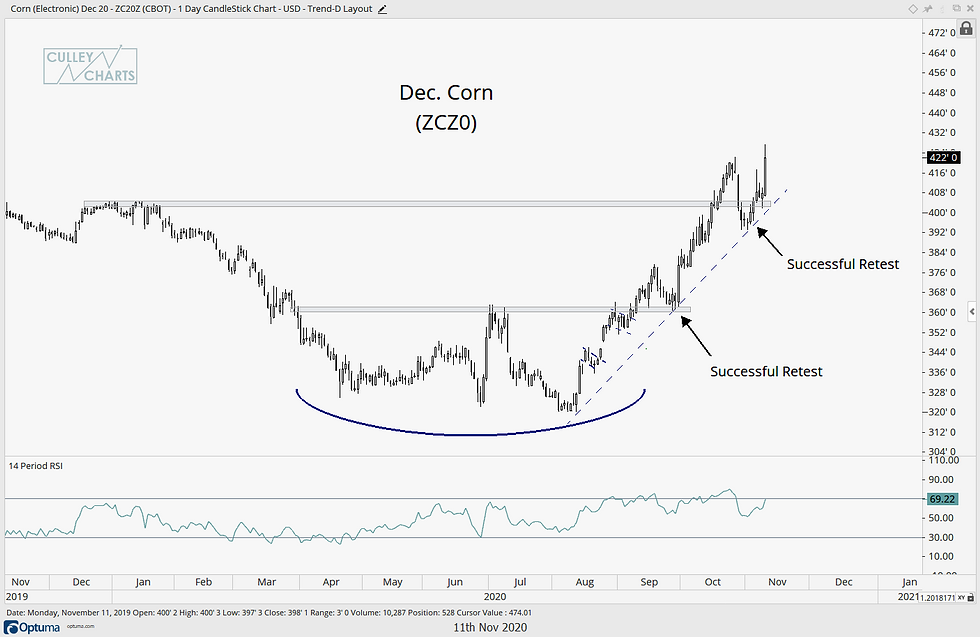
Nothing bearish on the daily chart of the most actively traded contract. It actually looks like things are just getting started and momentum looks strong.

The red line at the bottom of the Soybean Oil chart, like the weekly chart of Corn, signifies the position of Commercial Hedgers. The current profile is similar to those in the fall of 2016 and in early 2020. Both occasions ended with a move back into the trading range. Will Commercials be forced to capitulate, and will price finally move on from its 6 year base?

Yesterday Bean Oil posted a solid breakout on the daily chart. Notice the numerous flags that formed on the way up. These short term bullish patterns provide pyramiding opportunities, and indicate a strong trend is underway. I will keep an eye out for flags and pennants in the coming weeks and months.

The charts of Corn and Soybean Oil above depict demand absorbing overhead supply, and there's nothing bearish about that.
Thanks for reading! If you have any questions or comments, please feel free to contact me at ianculley@culleycharts.com
DISCLAIMER: All information and opinions expressed by Culley Charts are strictly that, and should not be construed as investment advice. Market participation comes with inherent risk, and the responsibility of managing this risk lies solely with each individual investor.

Comentarios